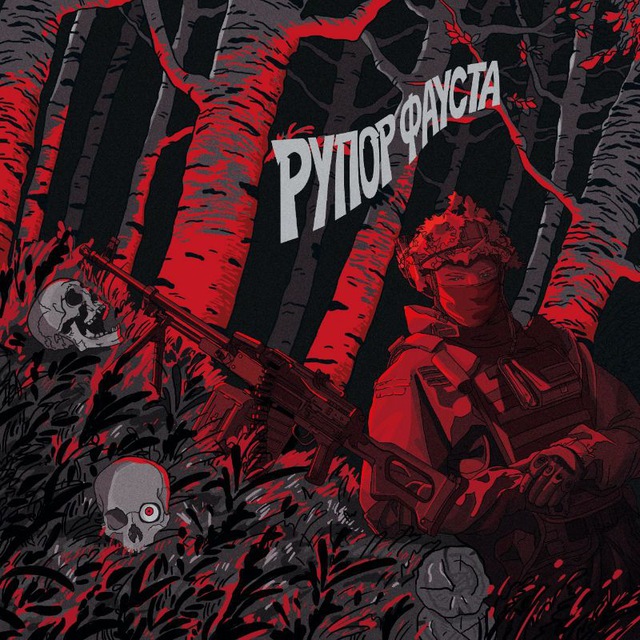
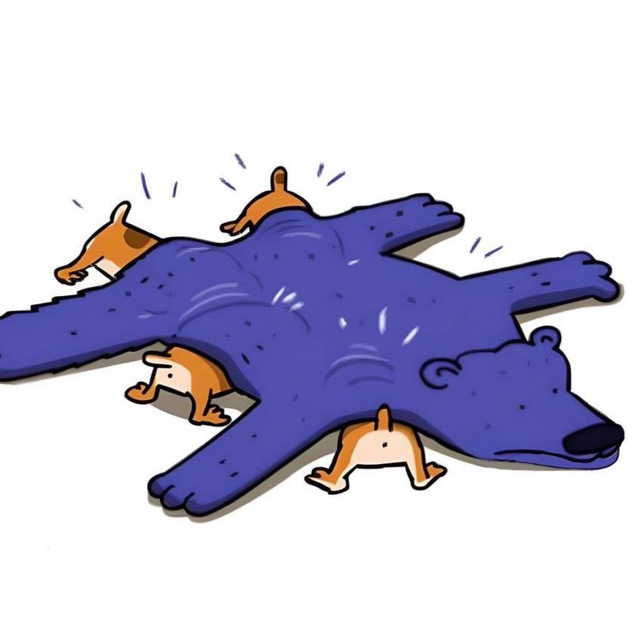
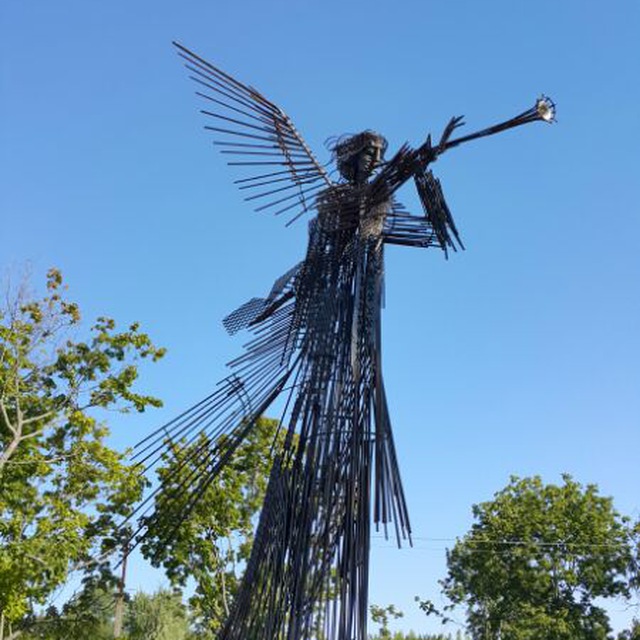
Какая из последних обложек лучшая? #art@blue_lock | #Blue_Lock


@blue_lock · VK
In the catalog since September 18, 2026 · metrics are recalculated every hour
The channel’s 30-day history (3 messages) will appear in your feed right away.
«Блю Лок» — спортивная сёнен-манга, выходящая в еженедельном журнале Weekly Shonen Magazine с 1 августа 2018-го года. Выпуском томов занимается издательство Kodansha. Сюжет строится вокруг проекта «Блю Лок», организованного после проигрыша японской сборной на ЧМ 2018 для создания лучшего и эгоистичного нападающего. За сценарий отвечает Канеширо Мунеюки, известный такими работами, как «Страшная воля богов» и «Джаган». Художником выступает Номура Юске («Убийцы Долли»). С 9 июня 2022 года начал выходить спин-офф под названием «Блю Лок: Путь Наги», за сюжет которого всё так же отвечает Канеширо Мунеюки, а художником выступает Санномия Кота, известный как автор «Заметок Теслы». Навигация по группе: #news@blue_lock — новости #twitter@blue_lock — посты из оф. твиттеров #art@blue_lock — арты фанатов #amv@blue_lock, #mad@blue_lock, #ve@blue_lock — видео-ролики от фанатов #coloring@blue_lock — покрасы #gif@blue_lock — гифки #edit@blue_lock — эдиты #cosplay@blue_lock — косплей #screen@blue_lock — скриншоты #mvsa@blue_lock — сравнение аниме и манги #перевод@blue_lock — перевод статей, промороликов и т.д. Страница включена в перечень персональных страниц, объем аудитории каждой из которых составляет более десяти тысяч пользователей социальной сети: https://gosuslugi.ru/snet/67b85f4af9540b3ae9964930
Blue Lock | Синяя тюрьма | Блю Лок is a VK community in the “News & Media” category. As of November 19, 2026 it has 19,859 subscribers; over 30 days it lost 72. It publishes 0.1 posts a day on average, a typical post reaches 879 (4% of subscribers). Engagement rate (ER): 3.1%. Latest post: 18 days ago. TeleMax data, updated every hour.
ER = reactions ÷ reach, ERR = views ÷ subscribers. Reach is the average post views over 30 days; the median next to it shows a typical post, and unlike the average it does not rise because of a single paid post. Latest post: 18 days ago. The subscriber count was measured 6 hours ago, other metrics were recalculated 6 hours ago.
| Day | Subscribers | Growth | Posts | Advertising | Per day | Total | Reactions |
|---|---|---|---|---|---|---|---|
| 19.11.2026 | 19,859 | −1 | 0 | — | — | — | — |
| 18.11.2026 | 19,860 | −4 | 0 | — | — | — | — |
| 17.11.2026 | 19,864 | −5 | 0 | — | — | — | — |
| 15.11.2026 | 19,869 | −2 | 0 | — | — | — | — |
| 09.11.2026 | 19,871 | 0 | 0 | — | — | — | — |
| 08.11.2026 | 19,871 | −4 | 0 | — | — | — | — |
| 07.11.2026 | 19,875 | 0 | 0 | — | — | — | — |
| 06.11.2026 | 19,875 | −2 | 0 | — | — | — | — |
| 05.11.2026 | 19,877 | −5 | 0 | — | — | — | — |
| 04.11.2026 | 19,882 | −3 | 0 | — | — | — | — |
| 03.11.2026 | 19,885 | +1 | 0 | — | — | — | — |
| 02.11.2026 | 19,884 | 0 | 0 | — | — | — | — |
| 01.11.2026 | 19,884 | 0 | 1 | 0 | 596 | 596 | 18 |
| 31.10.2026 | 19,884 | −3 | 0 | — | — | — | — |
| 30.10.2026 | 19,887 | −3 | 0 | — | — | — | — |
| 29.10.2026 | 19,890 | −5 | 0 | — | — | — | — |
| 28.10.2026 | 19,895 | −3 | 0 | — | — | — | — |
| 27.10.2026 | 19,898 | −13 | 0 | — | — | — | — |
| 26.10.2026 | 19,911 | −3 | 0 | — | — | — | — |
| 25.10.2026 | 19,914 | −7 | 1 | 0 | 898 | 898 | 33 |
| 24.10.2026 | 19,921 | −1 | 1 | 0 | 879 | 879 | 23 |
| 23.10.2026 | 19,922 | −4 | 0 | — | — | — | — |
| 22.10.2026 | 19,926 | −3 | 0 | — | — | — | — |
| 21.10.2026 | 19,929 | −2 | 0 | — | — | — | — |
| 20.10.2026 | 19,931 | — | 0 | — | — | — | — |
The “per day” column shows how many views the day’s posts gained in their first twenty-four hours: this value can be compared across days and channels. Where there is no measurement yet, an estimate marked “≈” is shown, based on the channel’s own reach curve. “Total” is the accumulated counter of the same posts as of today; it keeps growing. Ads and reactions also refer to that day’s posts, not to the channel over the day; on days without posts there is a dash. A dash in subscribers means the number was not measured that day; we do not fill in gaps.
Not enough posts for the map.
Not enough data.
The curve is built from hourly measurements and appears about a week after the channel enters the top tier.
This score is about our data, not about the channel: it also drops where the numbers are simply incomplete. Low reliability with high quality means “the channel is alive, but it is too early to trust its reach”.
Какая из последних обложек лучшая? #art@blue_lock | #Blue_Lock
#colour@blue_lock | #Blue_Lock

#colour@blue_lock | #Blue_Lock

#colour@blue_lock | #Blue_Lock
Какая из последних обложек лучшая? #art@blue_lock | #Blue_Lock
#colour@blue_lock | #Blue_Lock